Configuring ClickHouse data source in Grafana
The easiest way to modify a configuration is in the Grafana UI on the plugin configuration page, but data sources can also be provisioned with a YAML file.
This page shows a list of options available for configuration in the ClickHouse plugin, as well as config snippets for those provisioning a data source with YAML.
For a quick overview of all the options, a full list of config options can be found here.
Common Settings
Example configuration screen:
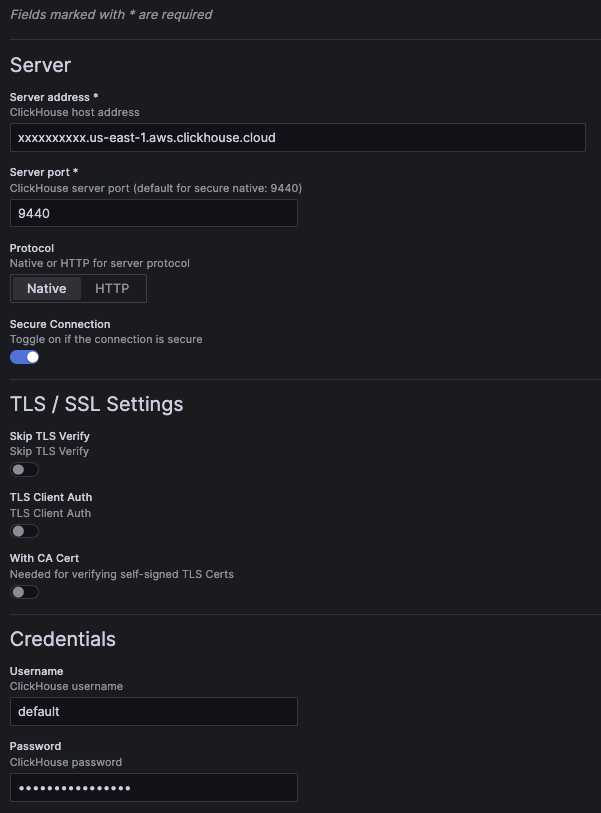
Example configuration YAML for common settings:
jsonData:
  host: 127.0.0.1 # (required) server address.
  port: 9000      # (required) server port. For native, defaults to 9440 secure and 9000 insecure. For HTTP, defaults to 8443 secure and 8123 insecure.

  protocol: native # (required) the protocol used for the connection. Can be set to "native" or "http".
  secure: false    # set to true if the connection is secure.

  username: default # the username used for authentication.

  tlsSkipVerify:     <boolean> # skips TLS verification when set to true.
  tlsAuth:           <boolean> # set to true to enable TLS client authentication.
  tlsAuthWithCACert: <boolean> # set to true if CA certificate is provided. Required for verifying self-signed TLS certificates.

secureJsonData:
  password: secureExamplePassword # the password used for authentication.

  tlsCACert:     <string> # TLS CA certificate
  tlsClientCert: <string> # TLS client certificate
  tlsClientKey:  <string> # TLS client key
Note that a version property is added when the configuration is saved from the UI. This shows the version of the plugin that the config was saved with.
HTTP Protocol
More settings will be displayed if you choose to connect via the HTTP protocol.
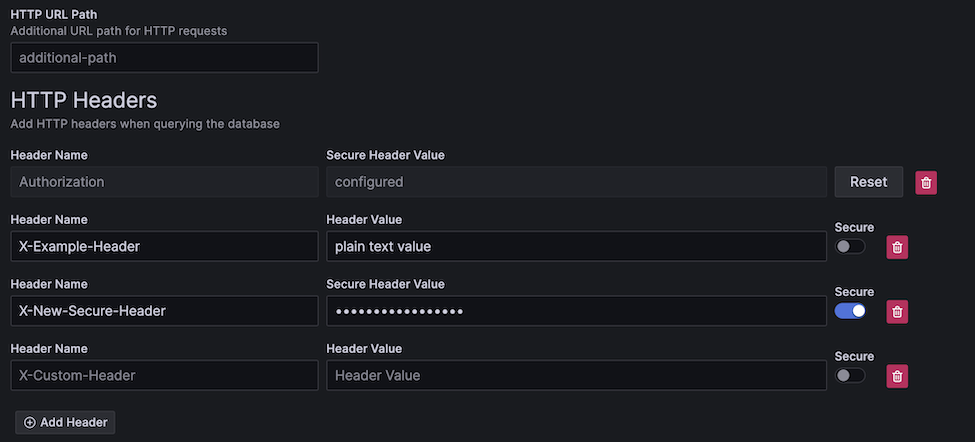
HTTP Path
If your HTTP server is exposed under a different URL path, you can add that here.
jsonData:
  # excludes first slash
  path: additional/path/example
Custom HTTP Headers
You can add custom headers to the requests sent to your server.
Headers can be either plain text or secure.
All header keys are stored in plain text, while secure header values are saved in the secure config (similar to the password field).
While secure header values are stored securely in the config, the value will still be sent over HTTP if secure connection is disabled.
Example YAML for plain/secure headers:
jsonData:
  httpHeaders:
  - name: X-Example-Plain-Header
    value: plain text value
    secure: false
  - name: X-Example-Secure-Header
    # "value" is excluded
    secure: true
secureJsonData:
  secureHttpHeaders.X-Example-Secure-Header: secure header value
Additional Settings
These additional settings are optional.
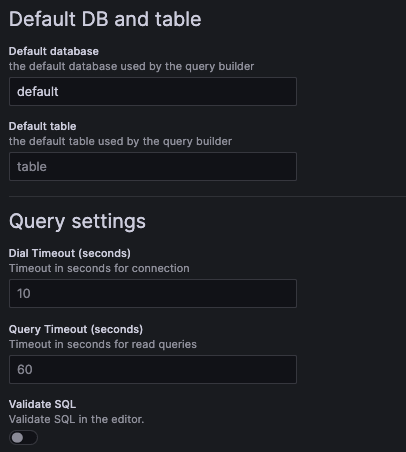
Example YAML:
jsonData:
  defaultDatabase: default # default database loaded by the query builder. Defaults to "default".
  defaultTable: <string>   # default table loaded by the query builder.

  dialTimeout: 10    # dial timeout when connecting to the server, in seconds. Defaults to "10".
  queryTimeout: 60   # query timeout when running a query, in seconds. Defaults to 60. This requires permissions on the user, if you get a permission error try setting it to "0" to disable it.
  validateSql: false # when set to true, will validate the SQL in the SQL editor.
OpenTelemetry
OpenTelemetry (OTel) is deeply integrated within the plugin. OpenTelemetry data can be exported to ClickHouse with our exporter plugin. For the best usage, it is recommended to configure OTel for both logs and traces.
It is also required to configure these defaults for enabling data links, a feature that enables powerful observability workflows.
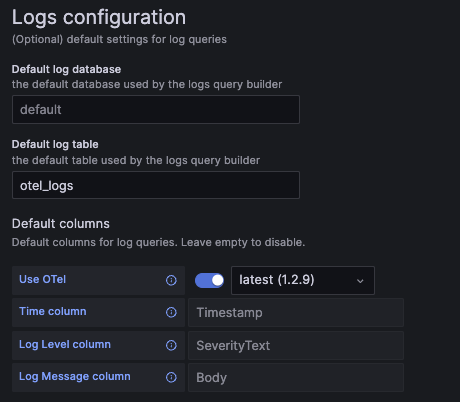
Logs
To speed up query building for logs, you can set a default database/table as well as columns for the logs query. This will pre-load the query builder with a runnable logs query, which makes browsing on the explore page faster for observability.
If you are using OpenTelemetry, you should enable the "Use OTel" switch, and set the default log table to otel_logs.
This will automatically override the default columns to use the selected OTel schema version.
While OpenTelemetry isn't required for logs, using a single logs/trace dataset helps to enable a smoother observability workflow with data linking.
Example logs configuration screen:
Example logs config YAML:
jsonData:
  logs:
    defaultDatabase: default # default log database.
    defaultTable: otel_logs  # default log table. If you're using OTel, this should be set to "otel_logs".

    otelEnabled: false  # set to true if OTel is enabled.
    otelVersion: latest # the otel collector schema version to be used. Versions are displayed in the UI, but "latest" will use latest available version in the plugin.

    # Default columns to be selected when opening a new log query. Will be ignored if OTel is enabled.
    timeColumn:       <string> # the primary time column for the log.
    logLevelColumn:   <string> # the log level/severity of the log. Values typically look like "INFO", "error", or "Debug".
    logMessageColumn: <string> # the log's message/content.
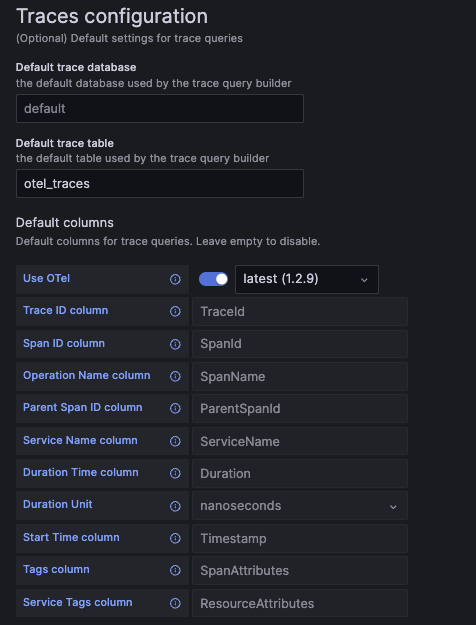
Traces
To speed up query building for traces, you can set a default database/table as well as columns for the trace query. This will pre-load the query builder with a runnable trace search query, which makes browsing on the explore page faster for observability.
If you are using OpenTelemetry, you should enable the "Use OTel" switch, and set the default trace table to otel_traces.
This will automatically override the default columns to use the selected OTel schema version.
While OpenTelemetry isn't required, this feature works best when using its schema for traces.
Example trace configuration screen:
Example trace config YAML:
jsonData:
  traces:
    defaultDatabase: default  # default trace database.
    defaultTable: otel_traces # default trace table. If you're using OTel, this should be set to "otel_traces".

    otelEnabled: false  # set to true if OTel is enabled.
    otelVersion: latest # the otel collector schema version to be used. Versions are displayed in the UI, but "latest" will use latest available version in the plugin.

    # Default columns to be selected when opening a new trace query. Will be ignored if OTel is enabled.
    traceIdColumn:       <string>    # trace ID column.
    spanIdColumn:        <string>    # span ID column.
    operationNameColumn: <string>    # operation name column.
    parentSpanIdColumn:  <string>    # parent span ID column.
    serviceNameColumn:   <string>    # service name column.
    durationTimeColumn:  <string>    # duration time column.
    durationUnitColumn:  <time unit> # duration time unit. Can be set to "seconds", "milliseconds", "microseconds", or "nanoseconds". For OTel the default is "nanoseconds".
    startTimeColumn:     <string>    # start time column. This is the primary time column for the trace span.
    tagsColumn:          <string>    # tags column. This is expected to be a map type.
    serviceTagsColumn:   <string>    # service tags column. This is expected to be a map type.
Column Aliases
Column aliasing is a convenient way to query your data under different names and types. With aliasing, you can take a nested schema and flatten it so it can be easily selected in Grafana.
Aliasing may be relevant to you if:
- You know your schema and most of its nested properties/types
- You store your data in Map types
- You store JSON as strings
- You often apply functions to transform the columns you select
Table-defined ALIAS Columns
ClickHouse has column aliasing built-in and works with Grafana out of the box. Alias columns can be defined directly on the table.
CREATE TABLE alias_example (
  TimestampNanos DateTime(9),
  TimestampDate ALIAS toDate(TimestampNanos)
)
In the above example, we create an alias called TimestampDate that converts the nanoseconds timestamp to a Date type.
This data isn't stored on disk like the first column, it's calculated at query time.
Table-defined aliases will not be returned with SELECT *, but this can be configured in the server settings.
For more info, read the documentation for the ALIAS column type.
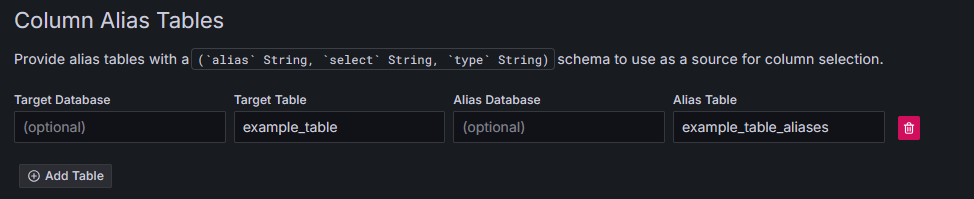
Column Alias Tables
By default, Grafana will provide column suggestions based on the response from DESC table.
In some cases, you may want to completely override the columns that Grafana sees.
This helps obscure your schema in Grafana when selecting columns, which can improve the user experience depending on your table's complexity.
The benefit of this over the table-defined aliases is that you can easily update them without having to alter your table. In some schemas, this can be thousands of entries long, which may clutter the underlying table definition. It also allows hiding columns that you want the user to ignore.
Grafana requires the alias table to have the following column structure:
CREATE TABLE aliases (
  `alias` String,  -- The name of the alias, as seen in the Grafana column selector
  `select` String, -- The SELECT syntax to use in the SQL generator
  `type` String    -- The type of the resulting column, so the plugin can modify the UI options to match the data type.
)
Here's how we could replicate the behavior of the ALIAS column using the alias table:
CREATE TABLE example_table (
  TimestampNanos DateTime(9)
);

CREATE TABLE example_table_aliases (`alias` String, `select` String, `type` String);

INSERT INTO example_table_aliases (`alias`, `select`, `type`) VALUES
('TimestampNanos', 'TimestampNanos', 'DateTime(9)'), -- Preserve original column from table (optional)
('TimestampDate', 'toDate(TimestampNanos)', 'Date'); -- Add new column that converts TimestampNanos to a Date
We can then configure this table to be used in Grafana. Note that the name can be anything, or even defined in a separate database:
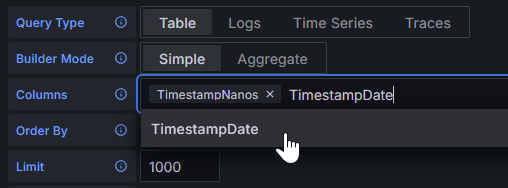
Now Grafana will see the results of the alias table instead of the results from DESC example_table:
Both types of aliasing can be used to perform complex type conversions or JSON field extraction.
All YAML Options
These are all of the YAML configuration options made available by the plugin. Some fields have example values while others simply show the field's type.
See Grafana's documentation for more information on provisioning data sources with YAML.
datasources:
  - name: Example ClickHouse
    uid: clickhouse-example
    type: grafana-clickhouse-datasource
    jsonData:
      host: 127.0.0.1
      port: 9000
      protocol: native
      secure: false
      username: default
      tlsSkipVerify: <boolean>
      tlsAuth: <boolean>
      tlsAuthWithCACert: <boolean>
      defaultDatabase: default
      defaultTable: <string>
      dialTimeout: 10
      queryTimeout: 60
      validateSql: false
      httpHeaders:
      - name: X-Example-Plain-Header
        value: plain text value
        secure: false
      - name: X-Example-Secure-Header
        secure: true
      logs:
        defaultDatabase: default
        defaultTable: otel_logs
        otelEnabled: false
        otelVersion: latest
        timeColumn: <string>
        levelColumn: <string>
        messageColumn: <string>
      traces:
        defaultDatabase: default
        defaultTable: otel_traces
        otelEnabled: false
        otelVersion: latest
        traceIdColumn: <string>
        spanIdColumn: <string>
        operationNameColumn: <string>
        parentSpanIdColumn: <string>
        serviceNameColumn: <string>
        durationTimeColumn: <string>
        durationUnitColumn: <time unit>
        startTimeColumn: <string>
        tagsColumn: <string>
        serviceTagsColumn: <string>
    secureJsonData:
      tlsCACert:     <string>
      tlsClientCert: <string>
      tlsClientKey:  <string>
      secureHttpHeaders.X-Example-Secure-Header: secure header value